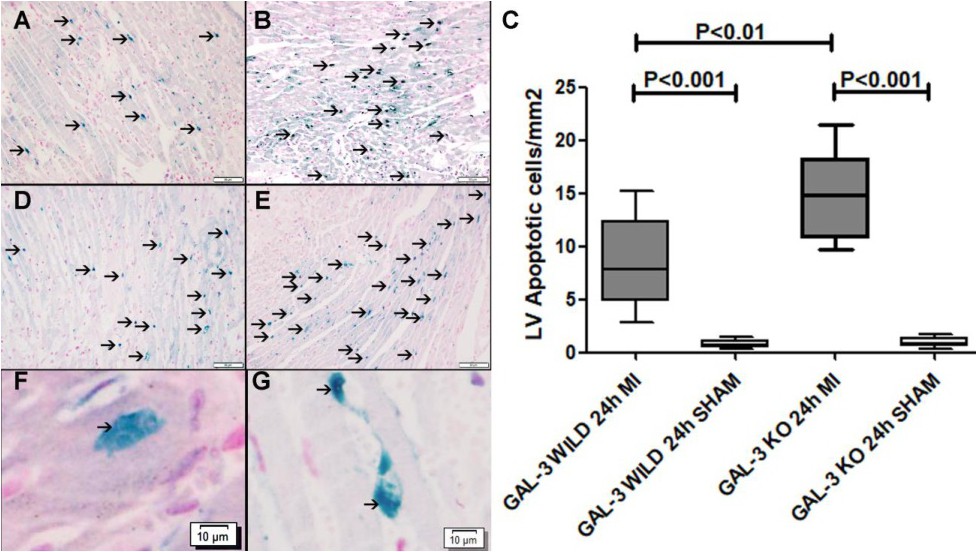
Fig. 3. CardioTACSTM In Situ apoptosis detection. A&C. Representative section from the LV of GAL-3 wild MI group at 24h following MI showing blue nuclear staining of apoptotic cells in the ischemic area (thin arrow). B&D. Representative section from the LV of GAL-3 KO MI group at 24-hour following MI showing blue nuclear staining of apoptotic cells in the ischemic area (thin arrow). E&F. A high power views show blue nuclear staining of apoptotic cardiomyocytes in the ischemic area (thin arrow). G. A morphometric graph showing a significantly higher number of blue-stained apoptotic cells in the LV of GAL-3 KO MI group than GAL-3 wild MI group, P value<0.05 is statistically significant.